Inventory Analysis
From the tool bar, click  > Inventory > Inventory Analysis >
  .
.
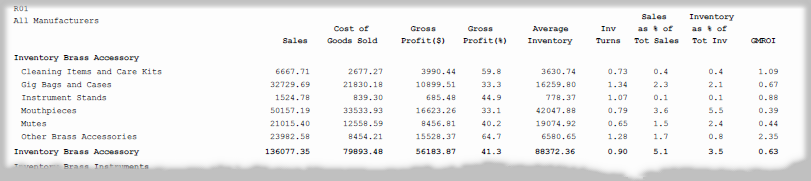
The Inventory Analysis report will provide you with the following information for each sub category of inventory:
Sales = Total sales of the sub category ending with the analysis date and beginning twelve months prior (in order to provide a yearly analysis)
Cost of Goods Sold = Total cost of goods sold for the sub category for the year being analyzed
Gross Profit ($) = Sales – Cost of Goods Sold
Gross Profit (%) = Gross Profit ($) / Sales or 1 – (Cost of Goods Sold / Sales)
Average Inventory * = Value of Inventory / # of Months Average Inventory has been run in the past twelve months
Inventory Turns = Cost of Goods Sold / Average Inventory
Sales as % of Total Sales = Sales of Sub Category / Total Sales
Inventory as % of Total Inventory = Average Inventory of Sub Category / Total Average Inventory
Gross Margin Return on Inventory = Gross Profit / Average Inventory
* For more information pertaining to Average Inventory, refer to "Average Inventory".
Note: If you have not been running 'Average Inventory' each month for a twelve month time period and you enter an Analysis Date that is prior to the Date Average Inventory was Last Run, the Average Inventory totals on the Inventory Analysis report may not be represented accurately.